General Analytics
This page shows a series of graphs that is a direct summary of the amount and usage of traffic within the application over a period of time. You can view by Mbps or Mbytes.
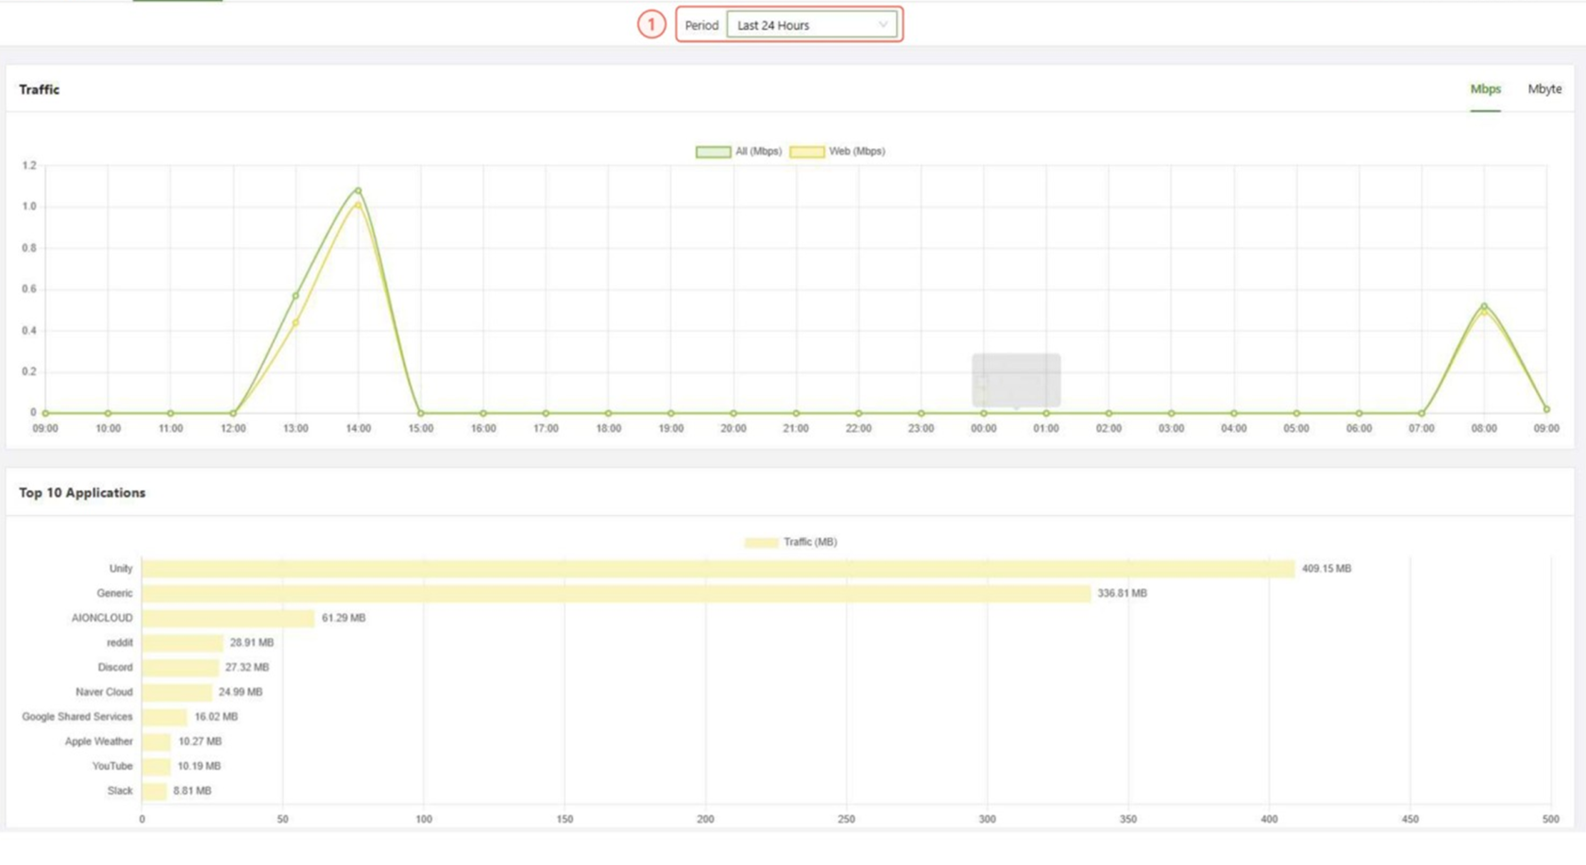
- Period: Filter the display based on the selected period of time.
Graphs
- Traffic: Displays all traffic over the specified period of time
- Top 10 Applications Groups: Displays the traffic usage for the top 10 applications Groups
- Top 10 Applications: Displays the traffic usage for the top 10 applications
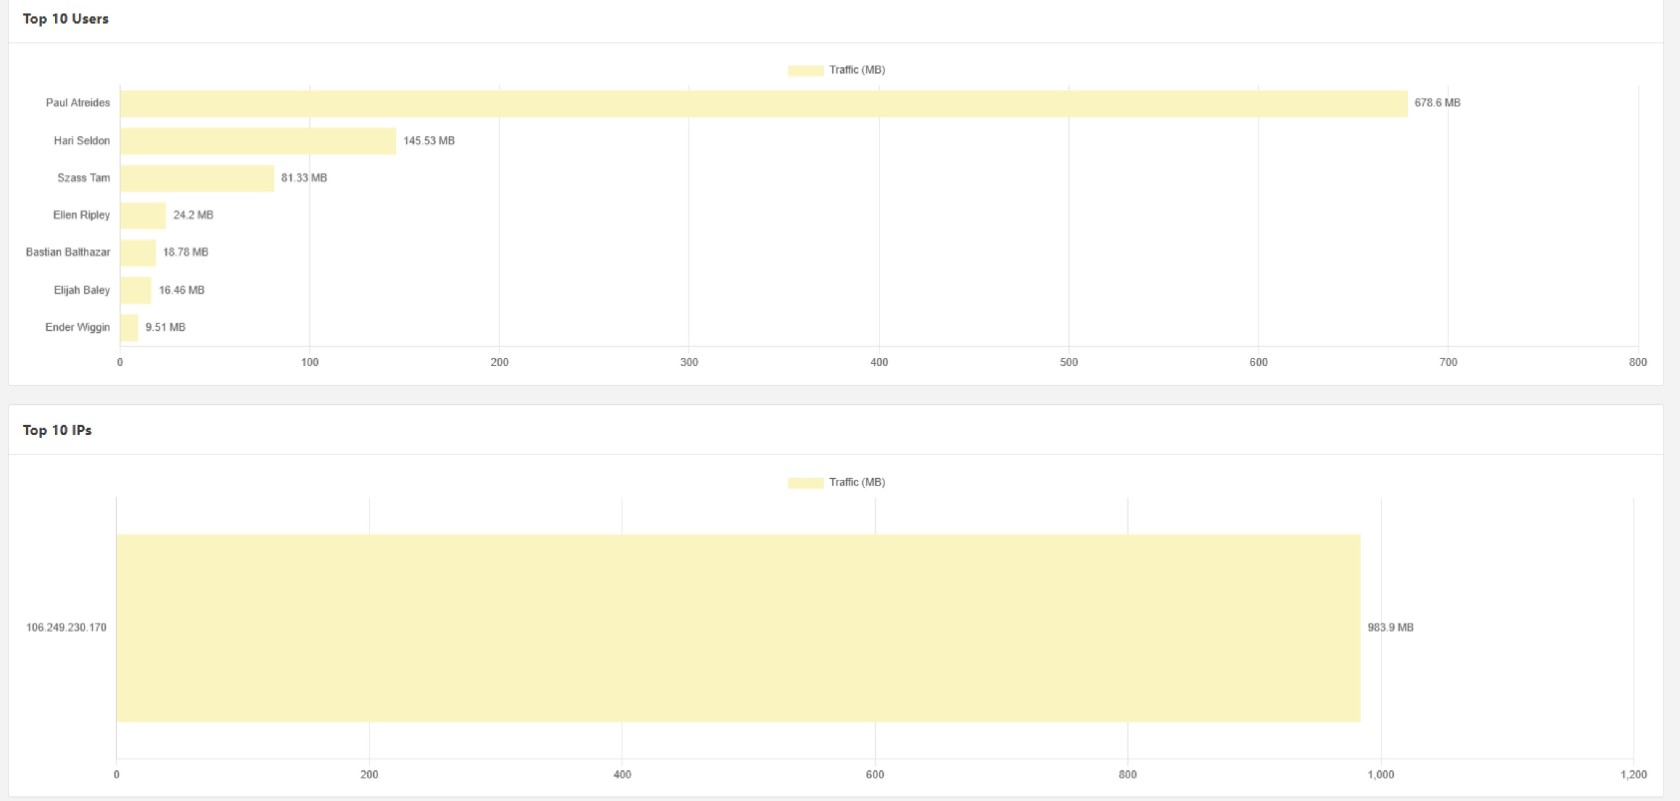
- Top 10 Users: Displays the traffic usage for the top 10 users
- Top 10 Source IPs: Displays the traffic usage for the top 10 Source IP addresses
- Top 10 Destination IPs: Displays the traffic usage for the top 10 Destination IP addresses
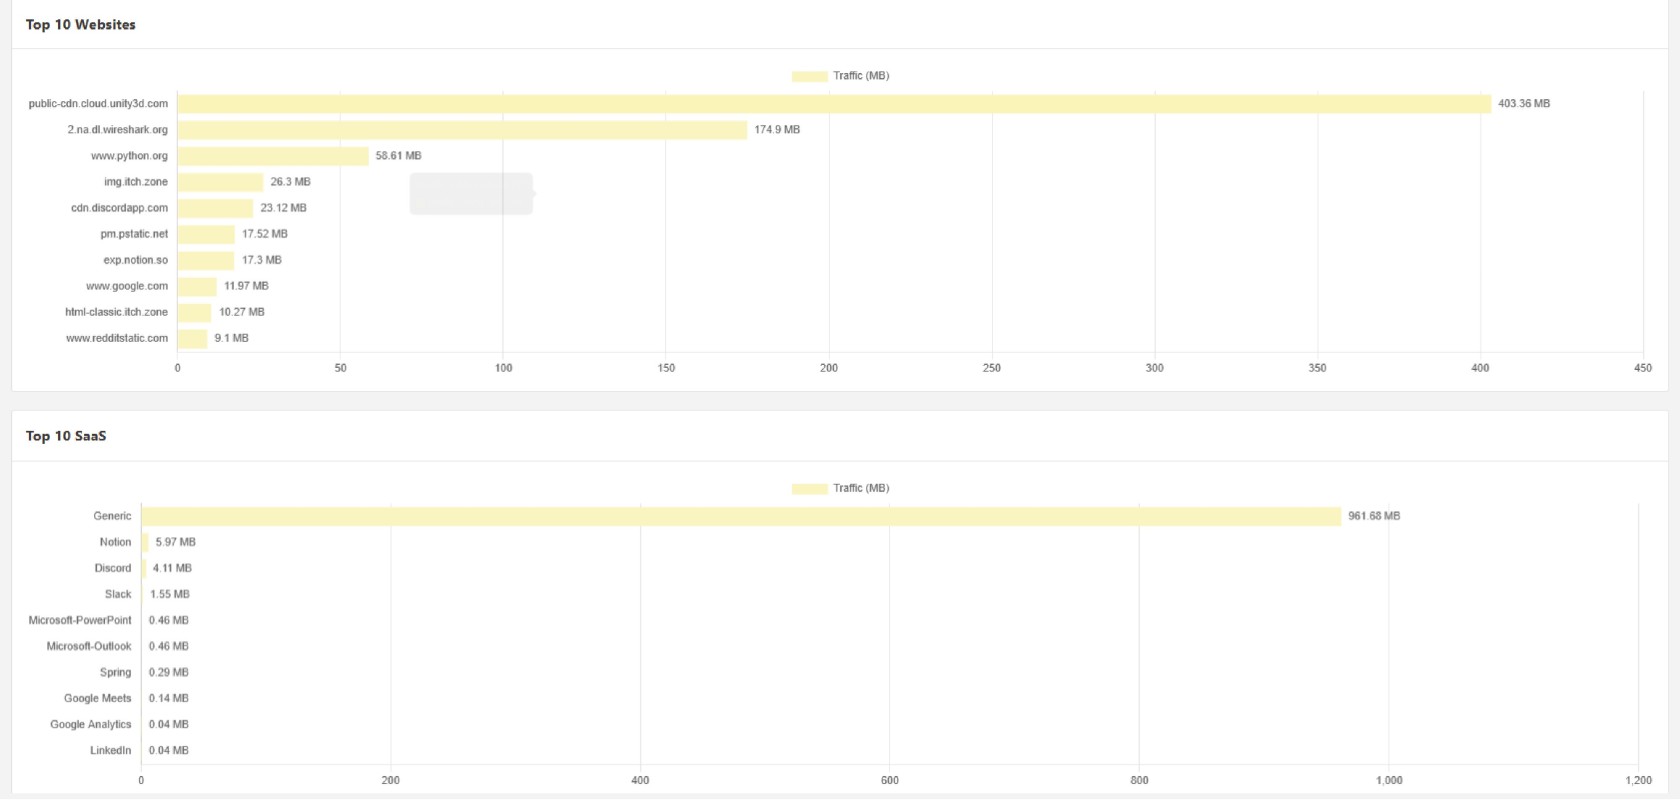
- Top 10 Websites: Displays the traffic usage for the top 10 websites
- Top 10 Web Categories: Displays the traffic usage for the top 10 Web Categories
- Top 10 SaaS: Displays the traffic usage for the top 10 CASB SaaS applications
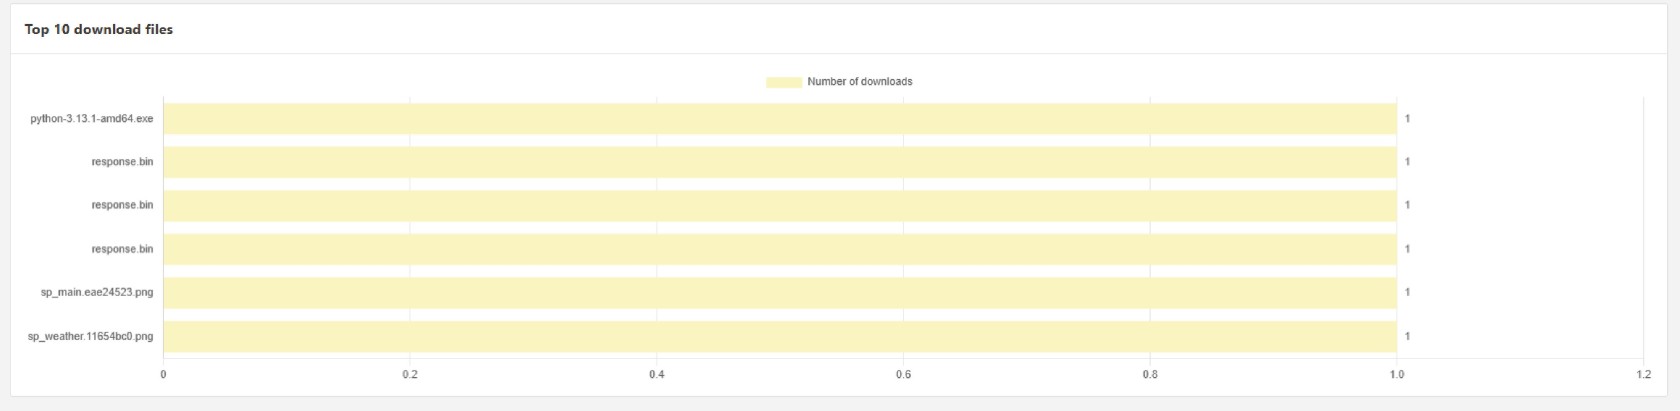
- Top 10 download files: Displays the number of downloads for the top 10 downloaded files