Log Overview
The Log menu of the SASE platform allow for the manager to view all logs generated by users connected via the connector agent. The Log menu is divided into 4 main sections, which are subdivided further depending on the type of log being accessed. The four main sections are as follows:
| Access | This section is used to view all web, access control and file access logs across all users. This has been separated into three separate sub-sections; Web, File and Access Control |
| Security | This section shows a list of all security logs created whenever a rule is activated, showing logs for all three main rule types, Allow, Detect and Block. It consists of six sections showing logs from the corresponding rules for Web, CASB, Firewall, Access Control, DNS, and Global Security. |
| Authentication | This section allows for the viewing of all authentication attempts made on both the connector agent application as well as on the SASE console. This will display both known and unknown users account attempts. |
| Audit | This section allows for the viewing of all changes made within the service, including whenever an account creates, updates or deletes a rule. As well as any login attempts that were successful during the specified period of time |
All log menus possess a search function used to filter the various fields displayed
Commonalities
All log menus have a certain degree of commonality across them. To avoid repetition, this section will cover the main features of logs that are common across all the different log types
Search Bar
The search bar for each log type may contain different variables, but the overall idea is consistent. The variables present in the search bar will always correspond to the variables present in the log outputs, allowing the manager to efficiently search for what is needed. Below is an example of a Web Access Log Search Bar, and an Access Control Security Log Search Bar
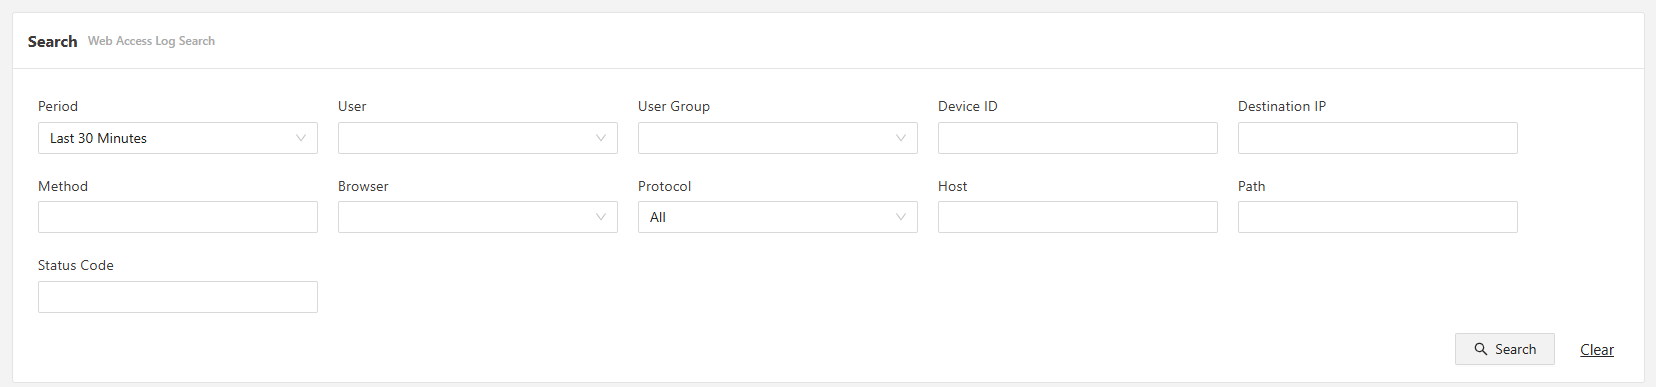
Web Access Log Search Bar
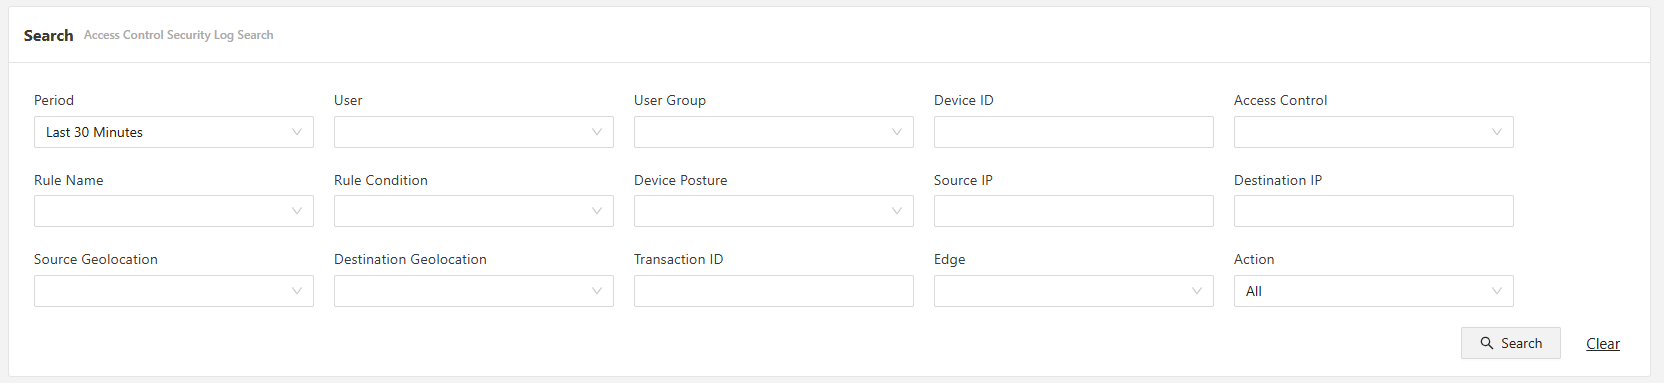
Access Control Security Log Search Bar
CSV Download
Each log type allows for the ability to download logs based on the filters that are currently applied in a CSV format. The CSV button is always located on the upper right hand side of the Log portion: see below
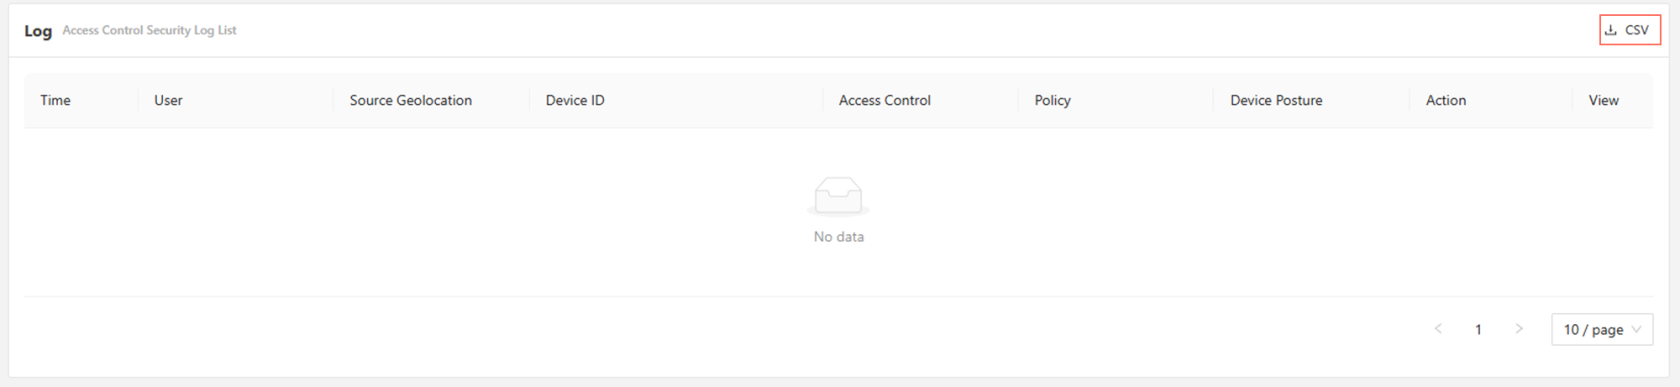
Simply apply the filters first to display on the desired logs, and then download via the CSV button
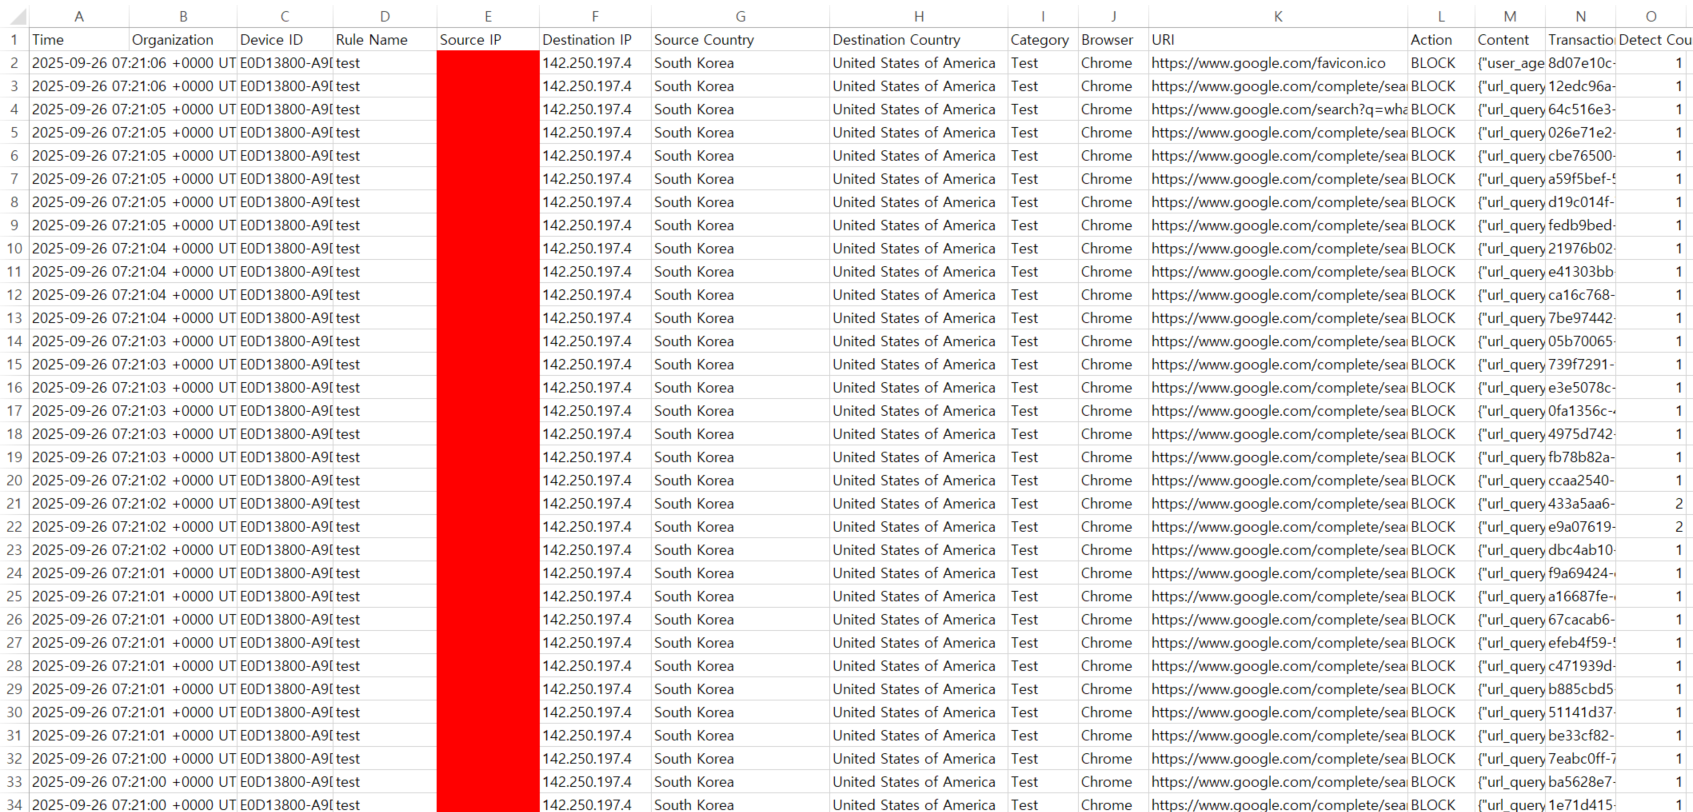
Example of a CSV file of a Web Security Log
Explore further:
- Access Logs
- Security Logs
- Authentication Logs
- Audit Logs