Service View
Service Tab
This sub-section shows a summary of the general usage of the service.
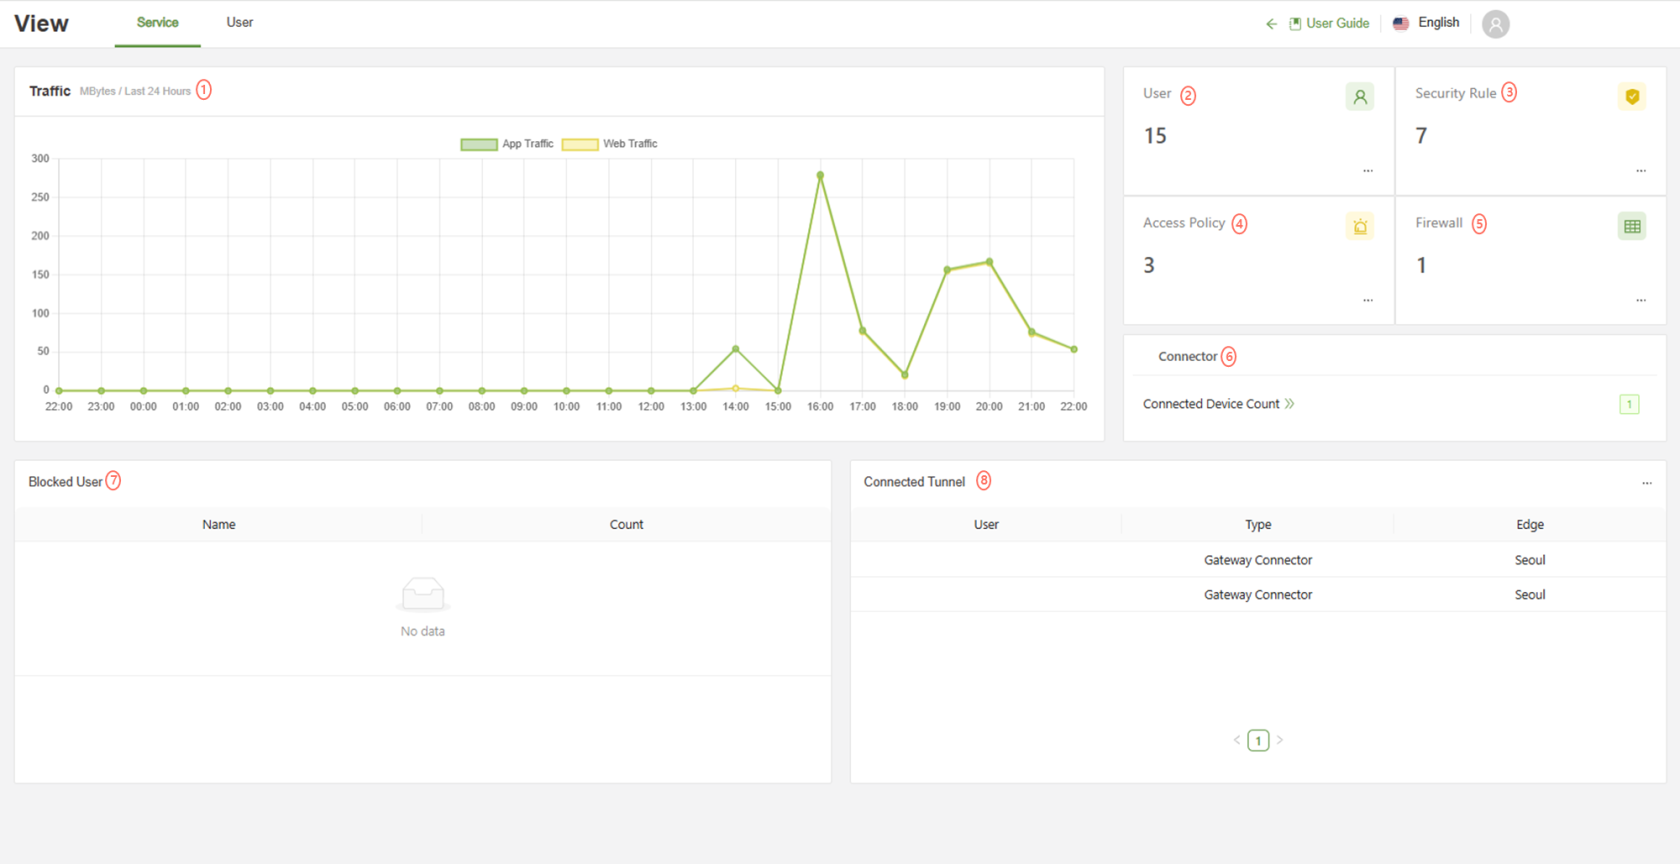
| Traffic | The traffic graph shows the total traffic sent by all users through the SSE EDGE. In this view, it is only set to the last 24 hours |
| User | The service usage on the right shows the overall number of users and policies setup in the service. ... Button: Will link immediately to the User Section of the service |
| Security Policy | Security policy will show the number of active policies from the Web>Policy tab ... Button: Navigates to the Web > Policy tab |
| Access Policy | Access Policy will show the number of active policies from the ZNTA > Access Policy tab ... Button: Navigates to the ZTNA > Access Policy tab |
| Firewall | Firewall will show the number of active policies from the Network> Application Firewall tab ... Button: Navigates to the Network > Application Firewall tab |
| Connector | Displays the overall number of devices currently connected to the workspace via the Connector Agent. Clicking on "Current number of connected devices" will change pages to View > User |
| Blocked Users | This part shows the username and number of times that user has been blocked by a security policy or access control policy |
| Connected Tunnel | This part shows the different servers and gateways currently connected through the ZTNA tunnel service ... Button: Navigates to the ZTNA > Tunnel tab |
The Service tab is best used to gain quick insights into usage of the SSE. At a glance, an administrator can know the total amount of App and Web traffic, how many users are registered, how many of those are using the Agent at the moment, the amount of total security policies, and who is getting blocked the most.
For a more detailed readout of each section, navigate to:
Web Traffic: Analytics -> Web
App Traffic: Analytics -> App
Users: User -> User
Security Policies: Web -> Policy
Blocked Users: Analytics -> User
Connected Users: View -> User